Showing posts with label Pivot Points. Show all posts

Monday, June 10, 2013

Tricks/Techniques in Pivot point trading


Now, knowing the basics we can move onto Forex tricks and tips we prepared for you to enhance your trading success with Pivots.

Pivot Trick 1 — early bird gets all worms. Early hours are where all support/resistance levels are tested. Later the market usually makes adjustments only. Early hours start from the first minutes of the new day! Sleep in and you've missed it.

Pivot Trick 2 — As we promised — Timing. 
London time and New York Time, think global. While we use New York time (EST) other traders are trading in other time zones. It is worth considering at least London market — one of the biggest currency markets. They use GMT. Therefore, their Pivots are calculated 5 hours later than ours, means they use different data and price ranges. Wouldn't it be helpful updating Pivots according to their time 5 hours later and see enhanced picture of the market? Yes, it would pay off!

While we use midnight-to-midnight Eastern Standard Time, some traders use New York closing time of 5:00 pm EST as the previous day's close.
As you can see there are many theories about timing. Try it out and find your own approach. 
(What about us? We base our calculations on midnight to midnight NY time).

We'd like to bring another useful point as an update to this page: 
Pivot Trick 2a — while using midnight pivots all day long, at 5 pm EST if you're still trading, calculate new pivots from 5:00pm to 5:00pm EST. They'll provide a fresh look on the market which will be valid till midnight when you recalculate new pivots according to midnight rules.

Feel confused after so many suggestions about timing? Then start it simple: begin with midnight EST Pivots only. Trade with those rules for some time. Then try out 5:00pm EST Pivots, see which ones work better for the strategy you trade. Add new rules only when you're comfortable with basic Pivots timing.

Learn basics about timing in Forex at Forexmarkethours.

Pivot Trick 3 — in case you prefer quick entries close to Pivot levels and like to use limit orders for that, keep in mind that setting positions too close to any Pivot level may put you in the situation when the order is triggered  but the price eventually closes on the other side and moves against you. That's why we don't use any preset orders; we wait for the bounce-off or break-through to happen and then manually open new trade at current market price.

Pivot Trick 4 — when Pivot Point is passed / crossed, price will in 95% of the cases hit first Support or Resistance level, what does it mean? — Sure fire profits. If you choose to take your profits at R1 or S1 level you will be winning it day after day! On the other hand, you may often see that during some other days your were exiting too early as the price moved further in your direction after you exited. It's up to you: opting for predictable profits or going for bigger dreams.

Pivot Trick 5 — mid-lines can be used for setting stop loss orders. Going Long at Pivot Point, set your stop loss order not right below the Pivot Point but below the mid-point between the Pivot Point and S1.
This will give you a better chance to survive if Pivot Point gets "poked".

Pivot Trick 6 — Use additional studies: technical indicators that show trend direction, trend lines, Fibonacci levels, MACD indicator, other studies that you are comfortable with to confirm your entries and exits.

Pivot Trick 7 — if during the day you spot congestion around one of the Pivot levels, use it to your advantage: set entry order on the break out of this congestion and just over the Pivot level which price is trying to concur.

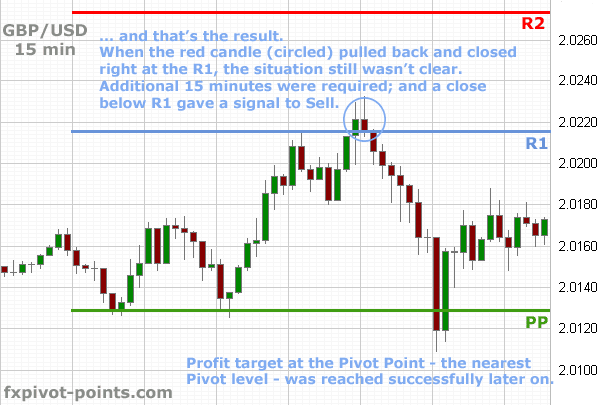
Pivot Tip 8 — if the market tried, but wasn't strong enough to reach R1 / S1 level and is already attacking Pivot Point to pull through on to the other side, be ready for trend change. Give the price chance to confirm its intentions by actually closing on the other side of the Pivot Point and shoot for the profits again setting the target at the first support/resistance level.

Pivot Tip 9 — we keep on saying that entering near the Pivot Point and then setting targets and the first support/resistance level is the easiest and the safest way to get sure profits.  What can help you to pick much better trades is looking at the amount of pips you can earn in each trade. Simply by analyzing the distance from the point you plan to enter to the next S1/R1 level you can tell if the trade worth attempting. If the amount of pips is very small it is probably not worth trading. This way you save yourself from taking unnecessary risks of losing money on a little-to-nothing promising trades. 

Pivot Tip 10 — by the time price reaches R2, R3 or S2, S3 the market will already be overbought or oversold and these levels should be used for exits rather than entries.

Pivot Tip 11 — How to calculate pivot points for Monday? To calculate Pivot points for Monday we use time from midnight EST on Friday to midnight EST on Sunday.

We hope you enjoyed studying Pivot points with our new ebook.
We wish you all the best in your Forex trading career!
Read more

Monday, June 3, 2013

Why do Pivot Points work?


The whole Pivot point trading technique is based on two main market concepts: existence of support and resistance. These two tendencies form the core of the market moves and therefore receive full attention from the vast majority of professional traders who trade on behalf of all kinds of large, medium, small financial institutions, funds as well as for themselves.

Because Pivot points are easy to calculate, millions of automated Forex trading systems in the world automatically execute buy / sell orders analyzing the market moves in relation to the Pivot points.

Also, there are very little variations that can take place when calculating Pivot points (those are only timing factors, but even then pivot points can quite often suggest the same data).
These precision in targets and mutual "agreement" among traders on certain key levels for the day cause the market to really shift, turn and move as huge percentage of traders pull in the same direction using basic Pivot points trading rules.

With EMAs crossing, for example, every trader can set different indicators and thus timing and reaction will not be so well coordinated. Also take Fibonacci, where for each time frame traders pull their own Fibonacci levels, same for trend lines — there are as many opinions out there as traders trading Forex. But when it comes to Pivot points, no matter what chart you use your Pivots will be the same, assuming that even with different time zones traders are able to find pretty close and quite often exact the same pivot point levels = levels of support and resistance, where everyone hits the same button at the same time.

Pivot points outperform other trading techniques and indicators also because they are predictive as opposed to lagging.

Because so many traders worldwide use Pivot points for trading, Forex market reacts at these levels in a quite predictable manner, respectinging support and resistance levels and creating a lot of trading opportunities.

Profitable trading!


Sourcing:
http://www.fxpivot-points.com

Read more

Monday, May 27, 2013

How do we pick entries?

Let's look at the next picture:
We have daily Pivots on 15 minutes chart. We wait for a pull back towards any of the closest Pivot levels, or, usually, towards the Pivot Point level. In this case Pivot Point level acts as a support.

We don't enter on the touch of the Pivot Point line. Why? Because we remember that the price do breaks through support / resistance levels, otherwise it would move constantly in one direction. So, instead of "jumping in fire", we wait.

Remember, before we actually see the price bouncing off the Pivot Point level, we can only expect it to do so. An expectation is not a good reason for entry. We need to see the price touching, stopping and then reversing. That's what we wait for. Another 15 minutes goes by and the situation clears: once we see a U-turn we enter!
Once the price has chosen a direction and we are in the trade, the first target is going to be the first level of support (downtrend) / resistance (in uptrend). What does that mean for us? It means that when opening a position around the Pivot Point the first profit target can be set to R1 or S1 level regarding the price direction. The guarantee that the market will reach that first level is very-very high. It does reach those first levels almost 95% of the time! You will be amazed how simple those quick profits are.

In general a trading area around R1, S1 and Pivot Point itself is the easiest and most predictable area to trade in.

As we know from the theory once a level of support is broken it becomes a level of resistance. Same for resistance, once broken — becomes support.

So, here come other Pivot levels such as S2 and R2. 
Let's take an uptrend. When the price starts to move up from the Pivot Point it aims at R1 level first. There the price usually meets a strong resistance which it needs to overcome before it can move any further. 
Once above R1, what is the next target? The next is R2. While aiming at R2, the price will have R1 level as its strong support now. It may or may not come back one more time to test R1 level before moving further up.

While holding a position, it is a common rule: if the price didn't "see" the first support / resistance, e.g. goes quickly through it without noticing / stopping, do not exit the trade, set your profit target at R2 because the market shows strength and is capable to push the price further to the next level. Typically, R2 becomes the highest point of the trading day.

However, R2 and S2 are not the ceiling for the price to stop at. During well trending market periods the price can move past those levels with no troubles at all.

If the market opens or trades at the extremes R2 or S2, the price will show a tendency to trade back toward the Pivot Point or even stop and go sideways. Try to avoid buying at R2 or selling at S2. 
A general rule for Pivot point trading can be set as:
The further the price moves away from a daily Pivot Point the lesser should be attempts to enter the market. Try catching the market when it is close to the Pivot Point in the beginning of the day; and if came late, avoid entering for the current day.

That's basically the way how traders use Pivot points in Forex trading. 
Although it sounds quite simple it requires a lot of attention and patience as well as mastering the technique of Pivot point trading.

Would you like to find out what happened later on the chart where we waited for clarification last time?

That day was very good, we made some healthy profits. 
But, it is important to remember that although Pivots are so remarkably helpful, there is always risk involved and not all 100% of trades turn out profitable. Using stops to protect your capital is a very wise choice and taking losses when went wrong is an everyday trading routine. Being truly realistic about Forex trading is a huge step forward.


Sourcing:
Read more

Monday, May 20, 2013

How to use Pivot points in Forex trading? The strategy.


Ok now let's start trading.
We are going to show you the way we trade Forex using Pivot points.

We calculate Pivot points on daily basis using daily charts and then use those Pivot levels on 15 minute charts — our main charts — where we will look for entries, stops and exits.
We use 15 minute time frame because it allows catching the best entry and exit opportunities. With hourly charts, for example, when the signal is there it is quite often already too late to react / enter.

We know we have to calculate Pivot points every single day, so that each morning we start with new fresh daily Pivot points, calculated from midnight to midnight EST.

Let's look at the current chart to see how Pivot points were found.
As you can see we use only 5 major Pivot point levels: R2, R1, PP, S1 and S2.

After Pivots are in place traders should start taking notes:

First, they should note where the market has opened today in relation to the Pivot Point (PP): above the Pivot Point or below it. The answer to this question provides the first clue about traders' biases for the day, e.g. if the market has opened above Pivot Point, traders will be bias towards taking long positions, on the contrary, opening below the Pivot Point would suggests shorting for the day.

Then traders should look at how far the price opened from the Pivot (PP), and make extra notes when it opened below S1 or above R1 level which is considered to be a quite distant open.

With some small distance away from the Pivot Point it is considered to be a good morning for trading. It is very much suggested to wait for a pull back towards the Pivot line before taking a position. 15 minute charts in this case help to catch the right moment for entry.

With the second — distant opening (below S1 or above R1) — we have very high expectations that the price will try to correct such "distant irregularity" and thus instead of progressing further away from Pivot Point it will try to move back towards the Pivot — the gold-middle point of the day. As a result, we will typically see a ranging market which does not produce much of the trading opportunities. The expectations are that the price will revolve around Pivot Point for the rest of the day — nothing to do for us, we stay out.

Read more

Monday, May 13, 2013

How to calculate Pivot points?

Pivot levels are derived from previous day High, Low and Close price values. Thus, every new day Pivot points must be reset using the newest data. As a rule traders take the time range from midnight to midnight, e.g. from midnight price bar to midnight bar.
Later we will introduce some traders' tricks about the timing.

Pivot points study provides traders with 5 major levels:

R2 — Second Resistance
R1 — First Resistance 
PP — Pivot Point 
S1 — First Support
S2 — Second Support

There are also additional levels, such as R3, S3 — third resistance and support, as well as Mid-points — middle levels between the major levels.


There are no limits on how many Pivot levels to use, however, one should remember, that making complex charts makes trading complicated as well. We would suggest sticking to 5 major Pivot point levels, around which most of the price action takes place.

The formula for calculating Pivot points is next:

Major 5 levels:

R2 = Pivot + (High — Low)        (same as R2 = Pivot + (R1 — S1))
R1 = 2 * Pivot — Low
Pivot = (High + Close + Low) / 3
S1 = 2 * Pivot — High
S2 = Pivot — (High — Low)      (same as S2 = Pivot — (R1 — S1))

Additional levels:

R3 = High + 2 * (Pivot — Low)
S3 = Low — 2 * (High — Pivot)
Midpoint between R1 and R2 = R1 + (R2 — R1) / 2
Midpoint between Pivot Point and R1 = Pivot + (R1 — Pivot) / 2

Online Pivot Point Calculator


Sourcing:
Read more

Monday, May 6, 2013

Pivot point Terminology


Before we speak about how to calculate and use Pivot point levels, let's define a few terms we will be using here:

PIVOT POINT is the point where the market reverses. It is a turning point. If the market is trading above Pivot Point it is considered to be a bull market (buyers are dominant), once it goes below the Pivot Point — it becomes a bear market (sellers are dominant).

RESISTANCE is a high point in the market where buyers meet strong opposition of sellers. A rising market reaching resistance has big potential of falling back down.

SUPPORT is a low point in the market where sellers meet strong opposition of buyers. A falling price reaching support has a big chance of climbing back up.

Support and resistance levels are difficult to break through, but they do fail, otherwise the price would be all the time going in one direction only...

There is a rule that once a support or resistance level is broken it becomes the opposite force: a broken support will become a resistance, and a broken resistance serves as a future support.

Let's look at the picture to see how it works:
Pivot point trading emphasizes on the importance of such support and resistance levels and its theory is based solely around those levels.


Sourcing:
http://www.fxpivot-points.com
Read more

Monday, April 29, 2013

What is Pivot point trading?


Pivot point trading is a technique widely used among Forex traders, that allows to determine important support/resistance levels for the day which derived from the previous day's trading range.

Pivot points — the key levels or certain price values for a current day — are points around which traders base their entries and exits. There are 5 major and several additional pivot levels, we are going to learn about them later.

In simple words, it is similar to knowing where the price is going to stop and reverse and how far it will go next time: The knowledge of such support/resistance levels is priceless as it allows to get in / out of the trade, set stop and profit orders with maximum advantage to traders.

In fact, if you have troubles seeing where the market is going, Pivot points can give you a clue! 
It is like having a map on your charts!

Compare the two charts below. 
That's the way traders would see a chart without Pivot points.

That's the chart with a Pivot "map" on it:

Obviously, the second chart had a great advantage over the first one. As we can see, for the whole trading day a trader was able to accurately predict price's turning points.

Pivot points are calculated daily, weekly and monthly. 
The most common are daily Pivot points. But important are all three: daily, weekly and monthly pivots. So, make it a habit once a week to set weekly pivots on a chart, once a month — refresh monthly pivot points.

For intraday trading traders calculate daily Pivots and then use them on the charts they prefer to trade with: hourly charts, 30 minutes, 15 minutes etc. We will learn how to trade with daily Pivot points on 15 minute charts.

As a rule all calculations are done by charting software, but Pivots can also be calculated manually. For this purpose we will have a formula below. However, a short-cut way would be to use an 
Online Pivot Point Calculator.

Few clicks, simple calculations and any trader, beginner or a pro can see the same exact key levels of importance; and no more price guessing..!


Sourcing:


Read more

Monday, April 22, 2013

Forex Pivot Points Book

By Jeff Boyd
Contents:

What is Pivot point trading?

Pivot point Terminology

How to calculate Pivot points?

How to use Pivot points in Forex trading?

Why do Pivot points work?

What are the most common tricks/techniques to use in Forex Pivot point trading?


Pivot points are sometimes associated with difficulties for Forex traders, especially for beginners.

oday we will try to explain as simple as possible about Pivot point trading so that tomorrow you can confidently apply this knowledge to your Forex trading!

Ever wondered why price stops and turns at some exact points? There are many answers and causes for that such as Fibonacci levels, trend lines support/resistance areas etc, but many of such stops-turns are quite often caused by Pivot point levels.

Ever wondered how daily signals and forecasts of exact price's turning / fighting points are predicted by expert traders?

Again, those traders take a lot of data into consideration, but they would never overlook Pivot point analysis!

Many Forex traders if not all successful ones do respect these important Pivot levels and heavily rely on them in making everyday trading decisions.

That's why we'd like to introduce Pivot points trading approach. Pivot point trading is a study that traders either going to know and use to their benefit OR allow additional unnecessary risks to be a part of everyday trading.


Sourcing:
http://www.fxpivot-points.com
Read more

PAMM Monitoring

Economic Calender

Guestbook