Showing posts with label Fibonacci. Show all posts

Monday, April 15, 2013

Fibonacci Fan


Fibonacci Fan is another Fibonacci retracement tool that takes both price and time into consideration. Comparing to horizontal Fibonacci lines it offers an additional feature — price movement projection far further in time.

The price projection is based on fan-like trend lines that represent already familiar to us Fibonacci numbers: 0.382, 0.500 and 0.618. 

That how it looks on the sketch:
To place Fibonacci Fan on the chart, choose Fibonacci Fan tool from menu on your trading platform and then look for the highest high and lowest low points (in other words two opposite peaks) at any given time to plot the tool on. Simply click on one peak and drug all the way to the other peak, the trading platform will build a fan for you.

Let's now take a look at the real chart:

Fibonacci Fan represents price future support and resistance levels. Traders can expect for the price either to stay in the fan and move in between lines, or break out of it.

When a price holds at any Fan line it indicates presence of support/resistance there. Once the price breaks through the line, it won't usually stop till the next Fan line is met.
If the price quickly passes a Fan line (which means there was no support/resistance there), it will freely move to the next Fan line.

Even trading outside the Fibonacci Fan, price can find strong support/resistance when approaching Fibonacci Fan line.

So, Fibonacci Fan gives traders a simple but effective way to predict future price movements.
However, it is recommended that Fibonacci Fan tool be traded along with other indicators or tools to avoid fake signals.

Sourcing:
http://www.fibonaccibook.com
Read more

Monday, April 8, 2013

Forex Fibonacci Calculator

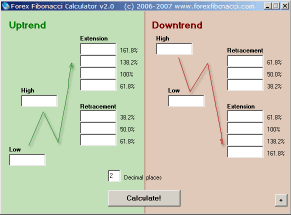
Knowing how to use Fibonacci retracements and extensions in the trade can bring your trading to a new successful level. We have created free software — Forex Fibonacci Calculator v2.1 (538Kb) — which can be downloaded and used whenever you need to learn more about the price on the Forex chart.
Forex Fibonacci Calculator v2.1 is a simple and useful tool that will help you to calculate Fibonacci extension and retracement levels for the market price. You will be able to anticipate market price moves and plan future trades according to the calculated results.

Note, that calculation formulas will differ for uptrend and downtrend moves, therefore use appropriate panel in the Calculator to input price values. 
You can also find those formulas used for calculating Fibonacci levels on the program panel below.

In order to calculate Fibonacci levels with this program traders need to fill in High and Low values for the price and click on "Calculate!"

Tip: Change default field "Decimal places" to get desired number of decimal places for calculated results.

Fibonacci calculations can be used for any currency pair and with any time frame. However, the bigger the time frame, the more accurate results traders should expect applying Fibonacci calculations.

Forex Fibonacci Calculator must be used only as a helping(!) tool for planning future trades. No liability will be taken for any losses or unwanted results caused by following the calculations obtained by using Forex Fibonacci Calculator.

We wish you profitable trading and hope this tool will help you to make one step forward in achieving your trading goals.


Sourcing:
http://www.fibonaccibook.com
Read more

Monday, April 1, 2013

How to calculate Fibonacci retracement and extension levels


Three most used Fibonacci retracement levels are 0.382 or 38.2%, 0.500 (50%) and 0.618 (61.8%).

Three most used Fibonacci extension levels are 0.618, 1.000 and 1.618. Also 1.382 extension can be applied as well.

Let's take a look at the next picture:
In the example above we are in the uptrend. Lowest swing — point A — is 120.75; 
highest swing — point B — 121.44.

To calculate retracement levels and enter Long at some point C we do next:

Calculations for Uptrend and Buy order:

B — A = ?
121.44 — 120.75 = 0.69

0.382 (38.2%) retracement = 121.44 — 0.69 x 0.382 = 121.18
0.500 (50.0%) retracement = 121.44 — 0.69 x 0.500 = 121.09
0.618 (61.8%) retracement = 121.44 — 0.69 x 0.618 = 121.01

Fibonacci retracement levels formula for an uptrend:

C = B — (B — A) x N%

Now we need to calculate extension levels:

0.618 (61.8% ) extension = 121.44 + 0.69 x 0.618 = 121.87
1.000 (100.0%) extension = 121.44 + 0.69 x 1.000 = 122.13
1.382 (138.2%) extension = 121.44 + 0.69 x 1.382 = 122.39
1.618 (161.8%) extension = 121.44 + 0.69 x 1.618 = 122.56

Fibonacci extension levels formula for an uptrend:

D = B + (B — A) x N%


Our next example is downtrend.

Highest swing — point A — is 158.20; lowest swing — point B — is 156.44.

Calculations for downtrend and Sell order:

A — B = ?
158.20 — 156.44 = 1.76

Because of the downtrend we need to add to the lowest point B to find retracement.

0.382 (38.2%) retracement = 156.44 + 1.76 x 0.382 = 157.53
0.500 (50.0%) retracement = 156.44 + 1.76 x 0.500 = 157.32
0.618 (61.8%) retracement = 156.44 + 1.76 x 0.618 = 157.11

Fibonacci retracement levels formula for downtrend:

C = B + (A — B) x N%

Now let's find Fibonacci extension levels (downtrend):

0.618 (61.8%) extension = 156.44 — 1.76 x 0.618 = 155.35
1.000 (100%) extension = 156.44 — 1.76 x 1.000 = 154.68
1.382 (138.2%) extension = 156.44 — 1.76 x 1.382 = 154.01
1.618 (161.8%) extension = 156.44 — 1.76 x 1.618 = 153.59

Fibonacci extension levels formula for downtrend:

D = B — (A — B) x N%


Sourcing:
http://www.fibonaccibook.com
Read more

Monday, March 25, 2013

Forex trading with Fibonacci method. Mini-lesson on how to use Fibonacci

Now let's have a look at a real forex chart.

Same steps will also apply to downtrend price movement.

A little bit of theory:
Leonardo Fibonacci is a founder of a simple series of numbers related to the natural proportions of things in the universe. Fibonacci numbers create ratios that arise from the following number series:0, 1, 1, 2, 3, 5, 8, 13, 21, 34, 55, 89, 144: Calculated this way: 0+1=1, 1+1=2, 1+2=3 and so forth.

The ratio of any number in relevance to the next higher number is 0.618. E.g. 55/89=0.618.
There is no need to perform calculation each time you get into a trade, your trading platform is going to do it for you.


Sourcing:
http://www.fibonaccibook.com
Read more

Monday, March 18, 2013

Fibonacci method in Forex


Straight to the point:

Fibonacci Retracement Levels are:
0.382, 0.500, 0.618 — three the most important levels
Fibonacci retracement levels are used as support and resistance levels.

Fibonacci Extension Levels are:
0.618, 1.000, 1.618 — three the most important levels
Fibonacci extension levels are used as profit taking levels.

So, what we will learn today is how to apply Fibonacci tool and how to interpret results that we see on the screen.

To set up Fibonacci on the chart we need to find out:
1. Is it uptrend or downtrend? 
2. Highest and lowest swings in the chart formation (A, B points).
And go with the trend!

So, click on Fibonacci tool from trading platform that you use. Now, as shown on the Figure 1:

We have an uptrend. A — our lowest swing, B — our highest swing. So, we will look to BUY some lots at the good lowest price and go up with the trend.

Click on A and drag your cursor to B, click. There you go! You must see different lines appeared on your chart. Those lines are called Fibonacci Retracement and Extension Levels.
To calculate Fibonacci levels yourself, refer to How to calculate Fibonacci levels.


So, what we are expecting is next: the price should retrace (go down) from point B to some point C, and then continue up in the direction of the trend. 
Those three dotted lines (0.618, 0.500, 0.382) at the bottom on our picture shows three Fibonacci retracement levels where we expect the price to take a U-turn and go up again. There we will place our BUY order.

The best situation would be to buy at the lowest level — 0.618 — point C. And on practice the price usually gives us this chance. However, 0.500 is also a good level to place a BUY order.

Well, let's take a look at the progress.

The price has successfully reached the lowest 0.618 point and made a U-turn.
So, now when we have our BUY order placed at desired point C, we would like to set some targets to take our profit in the future. For profit taking levels we use Fibonacci extension levels (0.618, 1.000, 1.618). The most common is 0.618 extension level,but when the price shows good potential to reach next 1.000 or even 1.618 level, you can leave your trade to get that target too.
We will choose 0.618 extension level as our profit target, and according to Figure 2, D is our point for taking profit.

Important note: in this Fibonacci tutorial 0.618 extension level (as well as 1.000, 1.618 levels) are calculated in relation to the point B, which means that B point represents a 0% extension.
Some Forex traders like to start counting from point A, then the distance from A to B would be already 100% of the price move. Thus moving further from B would be 1xx.x %.
For example: looking at the last picture, if to start counting from point A, then point D would be a 1.618 Fibonacci extension level or a 161.8% of the price move.


Sourcing:
http://www.fibonaccibook.com


Read more

PAMM Monitoring

Economic Calender

Guestbook